
This post originally appeared at https://www.badgerinstitute.org/five-surprising-facts-about-the-wisconsin-economy-experiencing-the-benefits-of-free-market-reforms/
Introduction:
How is Wisconsin doing, economically? Remarkably well, Badger Institute Visiting Fellow Scott Niederjohn finds as he examines the trends.

Our taxes are more competitive than they were even just a decade ago. We’re attracting people, unlike some neighboring states. Wisconsinites are more likely to work than are Americans generally, and we’re more likely to start businesses than people elsewhere. And since 2009, we’ve moved briskly up the ranking of jurisdictions by economic liberty, thanks to deliberate free-market reforms.
Niederjohn, who directs the Free Enterprise Center at Concordia University Wisconsin, brings the data showing how far Wisconsin has come. We hope you find it as encouraging as we did as we ponder the further reforms our state can pursue.
Free-market reforms are driving prosperity and fostering human flourishing in the Dairy State. This unmistakable trend is evident in state economic indicators from recent decades, a hopeful story that can instill pride in all Wisconsinites. This article will explore five potentially surprising facts about the Wisconsin economy. The surprise stems from the contrast between today’s vibrancy and the state’s historical reputation for high taxes and a less than friendly business climate.
1. Tax reform
Wisconsin has dramatically improved its competitiveness among the U.S. states in tax burden.
The days of Wisconsin being considered a “tax hell” are long gone. Over the past decade alone, Wisconsin has climbed 10 positions among the 50 states in the Tax Foundation’s Business Tax Climate Index. Currently, Wisconsin is near the middle of the pack, ranking 24th in 2024.1 Successive governors and legislative majorities of both parties have heard the message of the Badger Institute and free-market allies, and now the state has a tax burden below the national average, amounting to $102.60 per $1,000 of personal income. This burden is significantly lower than that of border states such as Minnesota ($121.70) and Illinois ($118.40). In recent years Wisconsin has repealed its personal property tax for businesses and reduced the lowest marginal income tax rate.
2. Net migration
People are moving to Wisconsin in greater numbers than they are leaving, bringing added economic prosperity with them.
The latest figures indicate that people are moving to Wisconsin in significantly larger numbers than they are moving out. According to the U.S. Census Bureau, net migration from 2022 to 2023 was a gain of 5,648 residents.2 During the same period, all of Wisconsin’s border states had a negative net migration balance. Illinois (-83,839), Iowa (-3,603), Michigan (-15,051), and Minnesota (-4,686) lost significant numbers of residents.
These statistics, from the Census Bureau’s Annual Population Estimates study, showed that California (-338,371) and New York (-216,778) were the states experiencing the greatest net domestic migration outflows, while Texas (+180,767) and Florida (+194,438) led in inflows.
At a more local level, Census figures show that of Wisconsin’s 72 counties, 58 gained population via net domestic migration. Table 1 reveals the top counties in positive net migration, led by Dane (2,092) and Waukesha (1,785). Table 2 shows the counties that lost the most population via domestic net migration, led by Milwaukee (-8,408) and Kenosha (-525).
Table 1
| Top five Wisconsin counties in net domestic migration by change in persons (2022 to 2023) | |
| County | Net Migration |
| Dane | +2,092 |
| Waukesha | +1,785 |
| Eau Claire | +885 |
| Winnebago | +659 |
| St. Croix | +522 |
Table 2
| Bottom five Wisconsin counties in net domestic migration by change in persons (2022 to 2023) | |
| County | Net Migration |
| Milwaukee | -8,408 |
| Kenosha | -525 |
| Clark | -191 |
| Trempealeau | -130 |
| Columbia | -121 |
Internal Revenue Service figures3 identify states that are gaining tax returns and individuals from Wisconsin — and the income that those moving individuals earned. Between 2020 and 2021, Florida emerged as the top gainer, adding the most tax returns (+2,166), individuals (+4,167) and adjusted gross income (+$463 million) from Wisconsin. Texas came in second.
The same measures show Wisconsin experienced its largest net gains from Illinois, with a net inflow of more than 7,400 individuals and almost $560 million in adjusted gross income in 2021. Notably, Wisconsin also saw positive migration from California, including net migration of more than 1,100 individuals and a net gain of more than $75 million in adjusted gross income.
Compared with our Midwest neighbors, Wisconsin gained returns, residents and income from Illinois, Iowa and Minnesota (Table 3). Relative to Michigan, the same measures show a gain in tax returns but a modest net loss in individuals and adjusted gross income. Analysis of the American Community Survey4 makes it clear that the counties in southern Wisconsin, along with Dane County, benefited the most from the positive net migration from Illinois. The gains from Minnesota are heavily concentrated in northwest Wisconsin, along the border near Minneapolis-St. Paul and, once again, in Dane County.
Table 3
| Sources of net migration to Wisconsin from border states — Net changes (2021) | |||
| State | Net tax returns to Wisconsin |
Net individuals to Wisconsin |
Net adjusted gross income to Wisconsin (in thousands of dollars) |
| Illinois | +4,145 | +7,468 | +$559,641 |
| Iowa | +184 | +304 | +$14,572 |
| Michigan | +16 | -304 | -$16,358 |
| Minnesota | +1,439 | +3,090 | +$243,892 |
3. Labor force participation and unemployment rates
Wisconsin has a vibrant labor market, typically outperforming the national average and bordering states.
As shown in Figure 1, since 2000 Wisconsin has experienced a lower unemployment rate than the country overall in every year except 2006 and 2007. Even amid historically low national unemployment rate such as 3.7% in 2023, Wisconsin still outperformed the nation with a rate at 3.4%.

A greater share of Wisconsin adults is also in the labor force than is true for the country as whole. Figure 2 depicts the difference. Wisconsin’s labor force participation rate (the percentage of adults who are working or looking for work) has been higher than that of the country overall in every year since 2000. Due to an aging population and retirements of the “baby boomer” generation, these numbers have declined both in Wisconsin and the U.S. Still, 65.8% of Wisconsin adults were in the labor force in 2023, while the overall national percentage was 62.6%.

Minorities, women and youth are finding opportunity in Wisconsin’s labor market, as indicated by these findings from 2023:
- Wisconsin’s black population labor force participation is 67.5% compared to 63.1% nationally.
- Among the Hispanic population, labor force participation is 72.7% in Wisconsin compared with 66.9% nationwide.
- Among women, Wisconsin exceeds the national average in labor force participation (61.8% in Wisconsin and 57.3% nationally).
- The unemployment rate among women in Wisconsin (3.0%) is lower than the national average (3.5%).
- Of Wisconsin residents between 16 and 19 years of age, 55.3% are in the labor force, compared with 36.9% nationally.
- Among the 20- to 24-year-old cohort in Wisconsin, 86.6% are in the labor force compared with only 71.3% nationally.
Wisconsin has also performed well in comparison with our neighboring states. As seen on Table 4, Wisconsin’s December 2023 unemployment rate of 3.3% is about the same as in Iowa (3.2%) and higher only than in Minnesota (2.9%). Wisconsin significantly outperforms Illinois (4.8%). Except for Michigan, all the labor force participation rates in the Midwest border states are stronger than the national average, with Wisconsin’s rate closely resembling the average of our peers.
Table 4
| Wisconsin and border states’ labor force statistics — December 2023 | ||
| State | Unemployment rate | Labor force participation rate |
| Illinois | 4.8% | 64.1% |
| Iowa | 3.2% | 67.5% |
| Michigan | 4.3% | 61.8% |
| Minnesota | 2.9% | 67.6% |
| Wisconsin | 3.3% | 65.4% |
4. Entrepreneurship and business formation
Wisconsin has become a better state to start a business, with new business formation surging.
In the area of business formation, Wisconsin is now well above the U.S. median. Forbes Advisor ranked Wisconsin the 14th best state to start a business in 2024.5 In this ranking, Wisconsin outpaced Illinois (ranked 28th), Iowa (31st), Michigan (40th), and Minnesota (43rd).
Meanwhile, data from the Bureau of Labor Statistics6 confirms that the Wisconsin economy has excelled in business creation, especially in comparison to Illinois. Figure 3 documents the yearly percentage change in new private businesses in Wisconsin and Illinois from 2014 to 2022. In most years, Wisconsin’s private sector outpaced Illinois in creating new businesses. And in no years did Wisconsin experience a decline in its base of private employers. In contrast, Illinois faced a decline of business establishments for three consecutive years, including a pronounced decline of almost 9% in 2017.
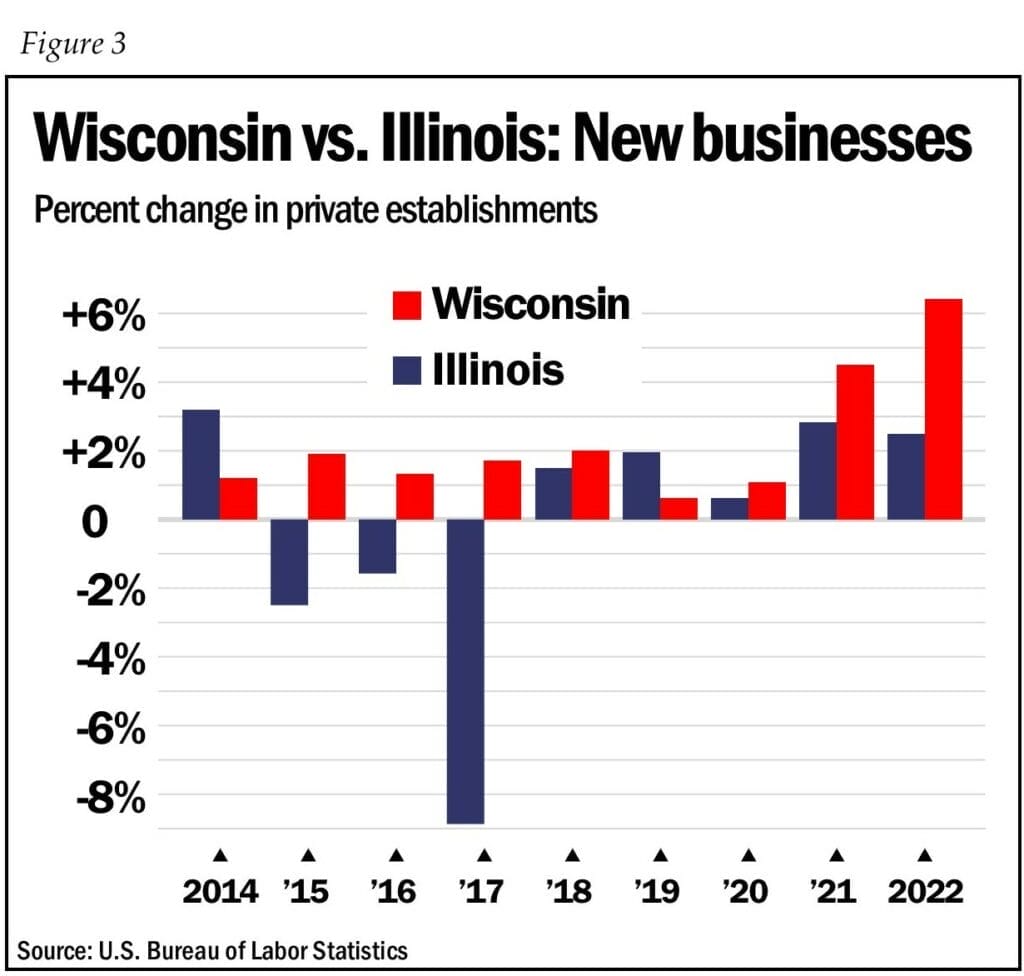
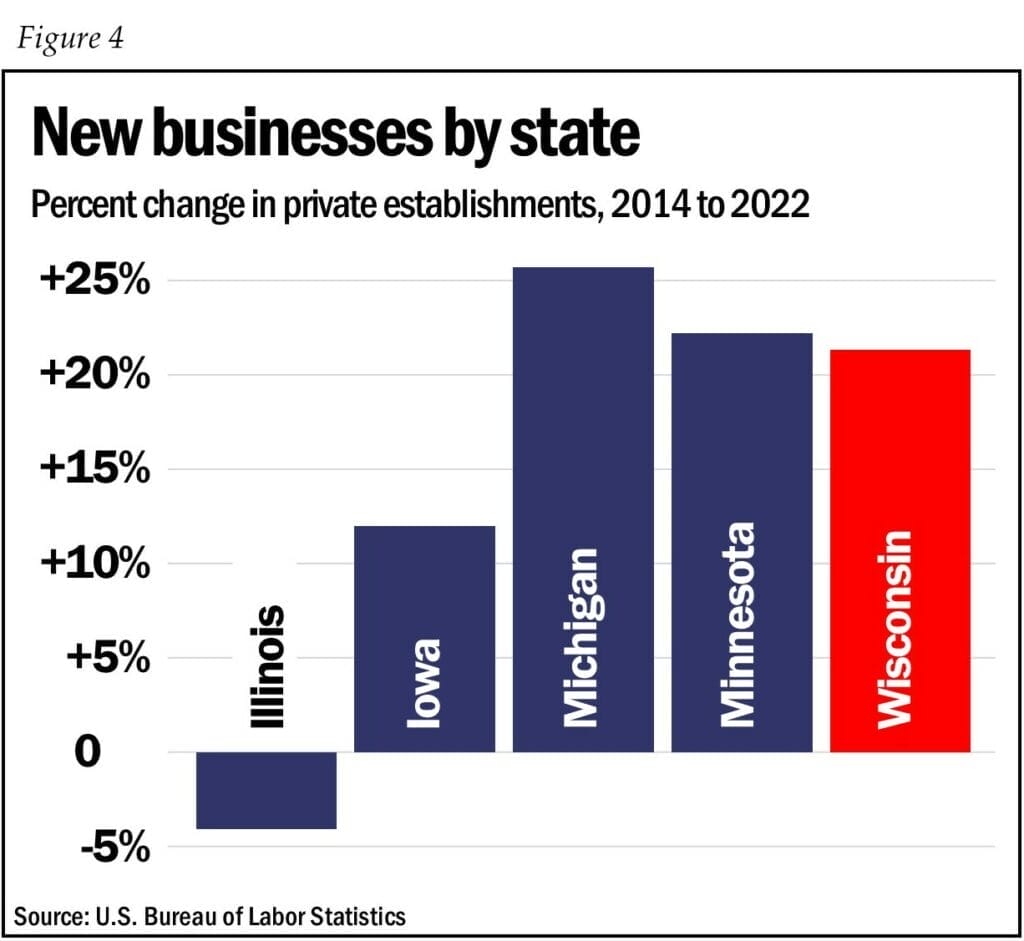
Figure 4 illustrates the percentage change in private business establishments between 2014 and 2022 for Wisconsin and all its neighboring states. Once again Illinois emerges as the laggard, experiencing a reduction of more than 4% in private businesses within the state over the period. Iowa’s private sector grew by a modest 12%, while growth was much stronger in Michigan (25.7%), Minnesota (22.2%) — and Wisconsin, where a 21.3% increase in private business establishments since 2014 represents more than 33,000 new private businesses.
5. Economic freedom
Wisconsin has become more economically free, driving its recent prosperity.
For an overall measure of economic freedom, we turn to the Vancouver-based Fraser Institute’s ranking of North American jurisdictions. These include U.S. states, Mexican states, and Canadian provinces. According to this measure, Wisconsin has notably increased its economic freedom. Since 2009 alone, the Badger State surged from 49th to 20th in North America.
To provide broader context, it’s worth noting that the Fraser Institute ranks both states and nations to assess those that are most and least free economically. In the institute’s most recent study of economic freedom in North America,7 using 2021 data, New Hampshire is ranked as the most economically free state, while New York ranks the least free. Interestingly, the top 30 most free jurisdictions in this study are American states, with Alberta the first non-U.S. jurisdiction to appear in the ranking, at number 31. The Mexican states take the bottom 32 spots.
Figure 5 displays the rankings in economic freedom over the history of this study for Wisconsin and its neighboring states. Minnesota has ranked among the least free states economically for the entirety of the study (ranked last in 1985 and 45th in 2021). Iowa has also seen its overall freedom ranking decline over time (from 14th to 23rd). Illinois has fallen from 31st to 36th.
Michigan has joined Wisconsin in improving its economic freedom over time. In 1985, the Fraser Institute study ranked Michigan the 44th most free state economically and Wisconsin the 45th. By 2009, Wisconsin had slipped to 49th place before experiencing recent improvements. Michigan has followed a similar upward trajectory, settling at 18 in the most recent rankings.

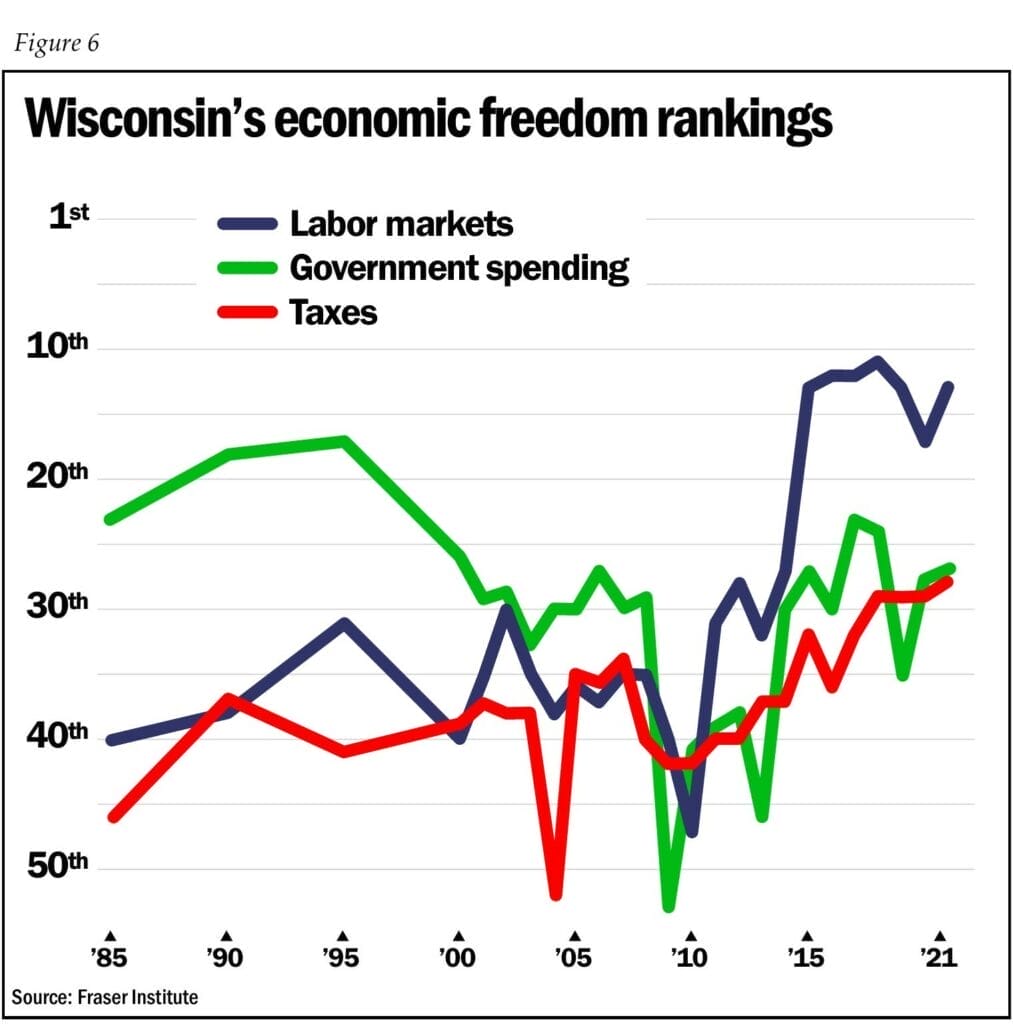
An additional study ranks the North American states and provinces on three measures: government spending, taxes, and labor market freedom. Wisconsin has made progress in each of these areas, as Figure 6 shows, but most dramatically in labor market freedom, becoming a “right to work” state in 2015. On this labor component of the economic freedom ranking, Wisconsin has moved from the 40th most free state to 13th since 1985. On taxes, Wisconsin now ranks as the 28th most free jurisdiction, a significant improvement from its ranking of 52nd in 2004. The ranking on government spending, while less free than in 1990, has improved significantly since 2009 (then ranked 53rd in North America).
Conclusion
Together, these indicators paint a picture of Wisconsin’s economy as particularly vibrant in recent years. Wisconsin consistently outperforms neighboring Illinois across diverse measures, showing higher rates of net migration, lower unemployment, greater labor force participation, increased entrepreneurship, and greater economic freedom. Wisconsin matches or surpasses its other neighboring states on the majority of these measures. Free market reforms in Wisconsin have transformed its economy from a “tax hell” in 1990s to a competitive economy that now ranks in the middle of the pack or above among U.S. states in tax burden, business climate, and economic freedom. Now is a good time to recognize these achievements and then to forge ahead.
Scott Niederjohn, a Badger Institute visiting fellow, is Professor of Economics and Director of the Free Enterprise Center at Concordia University Wisconsin in Mequon.
Author’s acknowledgement: The work of John Koskinen, Chief Economist for the Wisconsin Department of Revenue, provided the impetus to investigate many of these economic indicators, and his advice and help with acquiring and summarizing these data was invaluable in writing this article.
var gform;gform||(document.addEventListener(“gform_main_scripts_loaded”,function(){gform.scriptsLoaded=!0}),window.addEventListener(“DOMContentLoaded”,function(){gform.domLoaded=!0}),gform={domLoaded:!1,scriptsLoaded:!1,initializeOnLoaded:function(o){gform.domLoaded&&gform.scriptsLoaded?o():!gform.domLoaded&&gform.scriptsLoaded?window.addEventListener(“DOMContentLoaded”,o):document.addEventListener(“gform_main_scripts_loaded”,o)},hooks:{action:{},filter:{}},addAction:function(o,n,r,t){gform.addHook(“action”,o,n,r,t)},addFilter:function(o,n,r,t){gform.addHook(“filter”,o,n,r,t)},doAction:function(o){gform.doHook(“action”,o,arguments)},applyFilters:function(o){return gform.doHook(“filter”,o,arguments)},removeAction:function(o,n){gform.removeHook(“action”,o,n)},removeFilter:function(o,n,r){gform.removeHook(“filter”,o,n,r)},addHook:function(o,n,r,t,i){null==gform.hooks[o][n]&&(gform.hooks[o][n]=[]);var e=gform.hooks[o][n];null==i&&(i=n+”_”+e.length),gform.hooks[o][n].push({tag:i,callable:r,priority:t=null==t?10:t})},doHook:function(n,o,r){var t;if(r=Array.prototype.slice.call(r,1),null!=gform.hooks[n][o]&&((o=gform.hooks[n][o]).sort(function(o,n){return o.priority-n.priority}),o.forEach(function(o){“function”!=typeof(t=o.callable)&&(t=window[t]),”action”==n?t.apply(null,r):r[0]=t.apply(null,r)})),”filter”==n)return r[0]},removeHook:function(o,n,t,i){var r;null!=gform.hooks[o][n]&&(r=(r=gform.hooks[o][n]).filter(function(o,n,r){return!!(null!=i&&i!=o.tag||null!=t&&t!=o.priority)}),gform.hooks[o][n]=r)}});
Submit a comment
“*” indicates required fields
/* = 0;if(!is_postback){return;}var form_content = jQuery(this).contents().find(‘#gform_wrapper_21’);var is_confirmation = jQuery(this).contents().find(‘#gform_confirmation_wrapper_21’).length > 0;var is_redirect = contents.indexOf(‘gformRedirect(){‘) >= 0;var is_form = form_content.length > 0 && ! is_redirect && ! is_confirmation;var mt = parseInt(jQuery(‘html’).css(‘margin-top’), 10) + parseInt(jQuery(‘body’).css(‘margin-top’), 10) + 100;if(is_form){jQuery(‘#gform_wrapper_21’).html(form_content.html());if(form_content.hasClass(‘gform_validation_error’)){jQuery(‘#gform_wrapper_21’).addClass(‘gform_validation_error’);} else {jQuery(‘#gform_wrapper_21’).removeClass(‘gform_validation_error’);}setTimeout( function() { /* delay the scroll by 50 milliseconds to fix a bug in chrome */ jQuery(document).scrollTop(jQuery(‘#gform_wrapper_21’).offset().top – mt); }, 50 );if(window[‘gformInitDatepicker’]) {gformInitDatepicker();}if(window[‘gformInitPriceFields’]) {gformInitPriceFields();}var current_page = jQuery(‘#gform_source_page_number_21’).val();gformInitSpinner( 21, ‘https://e74sq7k37a8.exactdn.com/wp-content/plugins/gravityforms/images/spinner.svg’, true );jQuery(document).trigger(‘gform_page_loaded’, [21, current_page]);window[‘gf_submitting_21’] = false;}else if(!is_redirect){var confirmation_content = jQuery(this).contents().find(‘.GF_AJAX_POSTBACK’).html();if(!confirmation_content){confirmation_content = contents;}setTimeout(function(){jQuery(‘#gform_wrapper_21’).replaceWith(confirmation_content);jQuery(document).scrollTop(jQuery(‘#gf_21’).offset().top – mt);jQuery(document).trigger(‘gform_confirmation_loaded’, [21]);window[‘gf_submitting_21’] = false;wp.a11y.speak(jQuery(‘#gform_confirmation_message_21’).text());}, 50);}else{jQuery(‘#gform_21’).append(contents);if(window[‘gformRedirect’]) {gformRedirect();}}jQuery(document).trigger(“gform_pre_post_render”, [{ formId: “21”, currentPage: “current_page”, abort: function() { this.preventDefault(); } }]); if (event.defaultPrevented) { return; } const gformWrapperDiv = document.getElementById( “gform_wrapper_21” ); if ( gformWrapperDiv ) { const visibilitySpan = document.createElement( “span” ); visibilitySpan.id = “gform_visibility_test_21”; gformWrapperDiv.insertAdjacentElement( “afterend”, visibilitySpan ); } const visibilityTestDiv = document.getElementById( “gform_visibility_test_21” ); let postRenderFired = false; function triggerPostRender() { if ( postRenderFired ) { return; } postRenderFired = true; jQuery( document ).trigger( ‘gform_post_render’, [21, current_page] ); gform.utils.trigger( { event: ‘gform/postRender’, native: false, data: { formId: 21, currentPage: current_page } } ); if ( visibilityTestDiv ) { visibilityTestDiv.parentNode.removeChild( visibilityTestDiv ); } } function debounce( func, wait, immediate ) { var timeout; return function() { var context = this, args = arguments; var later = function() { timeout = null; if ( !immediate ) func.apply( context, args ); }; var callNow = immediate && !timeout; clearTimeout( timeout ); timeout = setTimeout( later, wait ); if ( callNow ) func.apply( context, args ); }; } const debouncedTriggerPostRender = debounce( function() { triggerPostRender(); }, 200 ); if ( visibilityTestDiv && visibilityTestDiv.offsetParent === null ) { const observer = new MutationObserver( ( mutations ) => { mutations.forEach( ( mutation ) => { if ( mutation.type === ‘attributes’ && visibilityTestDiv.offsetParent !== null ) { debouncedTriggerPostRender(); observer.disconnect(); } }); }); observer.observe( document.body, { attributes: true, childList: false, subtree: true, attributeFilter: [ ‘style’, ‘class’ ], }); } else { triggerPostRender(); } } );} );
/* ]]> */
1. https://taxfoundation.org/research/all/state/2024-state-business-tax-climate-index/
2. https://www.census.gov/data/tables/time-series/demo/popest/2020s-state-total.html
3. https://www.irs.gov/statistics/soi-tax-stats-migration-data
4. https://www.census.gov/programs-surveys/acs
5. https://www.forbes.com/advisor/business/best-states-to-start-a-business/
6. https://www.bls.gov/ces/data/
The post Five surprising facts about the Wisconsin economy: Experiencing the benefits of free market reforms appeared first on Badger Institute.