
This post originally appeared at https://www.badgerinstitute.org/misers-v-big-spenders-and-where-the-badger-state-fits-in/

Ever interested in how Wisconsin can spend less on government, we found fewer examples of parsimonious politicians elsewhere in America than we’d hoped.
How does Wisconsin’s spending compare to other states?
It depends which ones you’re looking at and what sort of spending counts.
State spending
There are two ways to compare government spending in Wisconsin to other states: a comparison of state spending alone and a comparison of combined state and local spending, a method that takes into account the fact that government services paid for at the state level in one place can sometimes be paid for at the local level in another place, or vice versa.
When it comes to expenditures at the state level alone, Wisconsin is below the national average. Data compiled by the Urban Institute & Brookings Institution Tax Policy Center show that Wisconsin’s per capita state direct general expenditure in 2021 was $5,149, ranked 31st in the country.i The national average was $5,336.ii Wisconsin’s per capita spending is also just slightly less than the average of the other Great Lakes states of Illinois, Indiana, Michigan, Minnesota and Ohio, which was $5,158.
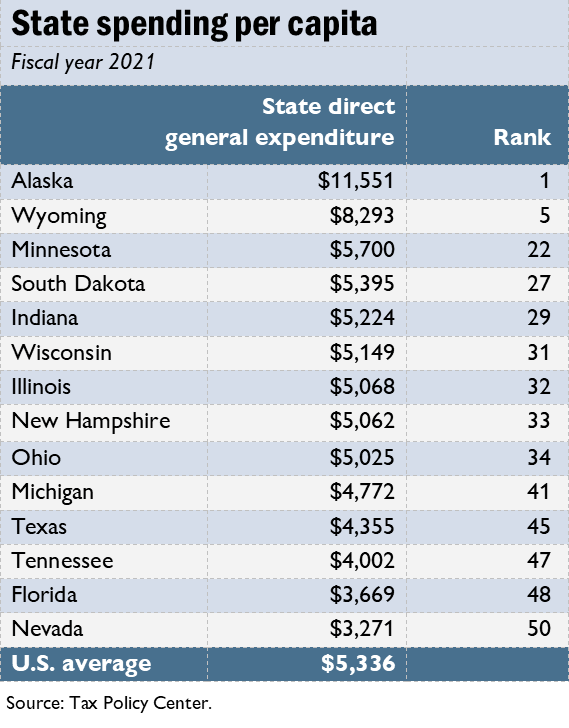
Of the eight states without an income tax, Wisconsin’s state government spends less than three — Alaska, Wyoming and South Dakota — and more than the other five. The average of all states without an income tax is $5,639. If we remove what could arguably be called outliers, Alaska and Wyoming, the average is $4,415. Alaska and Wyoming spend on average $9,922.
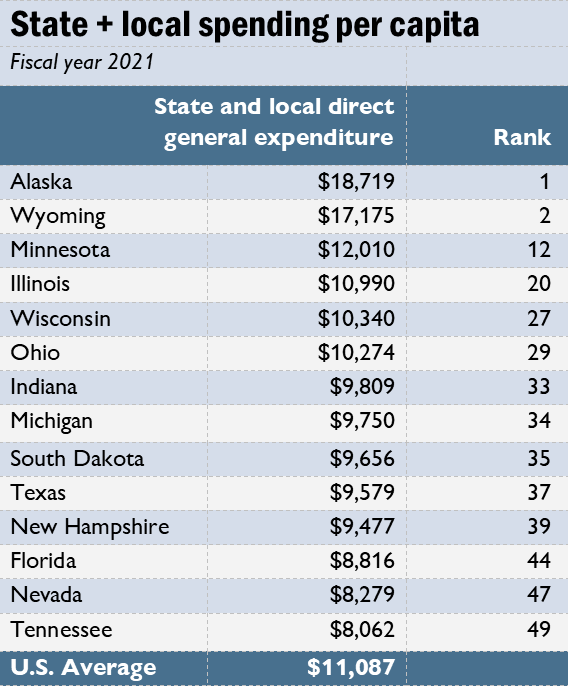
We can also compare combined state and local governmental spending, since the two budgetary streams are interrelated in Wisconsin as well as elsewhere. According to the Tax Policy Center, the average for all states for combined state and local direct general government expenditures was $11,087 per capita in 2021.iii Wisconsin spent $10,340, less than the U.S. average and, again, less than the average of $10,527 for the Great Lakes states.
Looking again at combined state and local expenditures, the average of all states without income taxes is $11,123 compared to Wisconsin at $10,340. In this comparison, only Alaska and Wyoming spend more, an average of $17,947. In this comparison, South Dakota joins New Hampshire, Florida, Tennessee, Texas and Nevada as states that spend less, an average of $9,173.
What would it have been?
Although per-capita figures are a helpful means of comparison between states of different sizes, it is also important to look how much Wisconsin would spend if its per-capita spending were the same as other states.
Examining state-level expenditures only, Wisconsin’s direct general expenditure in 2021 was approximately $30.28 billion.iv If Wisconsin had spent the equivalent of the U.S. average per-capita expenditure, it would have spent about $31.4 billion. If the state spent at the average level for Great Lakes states, it would have spent $30.33 billion. If it spent at the average level of states without an income tax, it would spend $33.5 billion. If we omit Alaska and Wyoming — and instead include only South Dakota, Texas, New Hampshire, Florida, Nevada and Tennessee — Wisconsin would spend at a per-capita rate of $4,292 for a total expenditure of $25.2 billion.
When local expenditures are factored in, Wisconsin again falls somewhat below the national average. Wisconsin’s combined state and local expenditure in 2021 was approximately $60.8 billion.v If Wisconsin’s per-capita state and local spending were equal to the national average, total spending would be as high as $65.2 billion. Spending at the Great Lakes average would increase total state and local spending to approximately $61.9 billion.
For Wisconsin to spend at a per-capita rate similar to states without an income tax, spending would increase to $65.4 billion. If Wyoming and Alaska are omitted, the remaining zero-income-tax states (South Dakota, Texas, New Hampshire, Florida, Nevada and Tennessee) spend at a per-capita rate of $9,713 – a rate that in Wisconsin would translate into spending $53.9 billion, or about 11.3% less.
Wyatt Eichholz is the Badger Institute’s Policy and Legislative Associate. He has a master of arts degree in economics from the University of Alabama.
Any use or reproduction of Badger Institute articles or photographs requires prior written permission. To request permission to post articles on a website or print copies for distribution, contact Badger Institute President Mike Nichols at mike@badgerinstitute.org or 262-389-8239.
More on Wisconsin’s income tax
This essay is adapted from the Badger Institute’s recent policy brief on the trade-offs in eliminating Wisconsin’s income tax. The full paper, which examines how states without income taxes raise revenue, is found here.
var gform;gform||(document.addEventListener(“gform_main_scripts_loaded”,function(){gform.scriptsLoaded=!0}),window.addEventListener(“DOMContentLoaded”,function(){gform.domLoaded=!0}),gform={domLoaded:!1,scriptsLoaded:!1,initializeOnLoaded:function(o){gform.domLoaded&&gform.scriptsLoaded?o():!gform.domLoaded&&gform.scriptsLoaded?window.addEventListener(“DOMContentLoaded”,o):document.addEventListener(“gform_main_scripts_loaded”,o)},hooks:{action:{},filter:{}},addAction:function(o,n,r,t){gform.addHook(“action”,o,n,r,t)},addFilter:function(o,n,r,t){gform.addHook(“filter”,o,n,r,t)},doAction:function(o){gform.doHook(“action”,o,arguments)},applyFilters:function(o){return gform.doHook(“filter”,o,arguments)},removeAction:function(o,n){gform.removeHook(“action”,o,n)},removeFilter:function(o,n,r){gform.removeHook(“filter”,o,n,r)},addHook:function(o,n,r,t,i){null==gform.hooks[o][n]&&(gform.hooks[o][n]=[]);var e=gform.hooks[o][n];null==i&&(i=n+”_”+e.length),gform.hooks[o][n].push({tag:i,callable:r,priority:t=null==t?10:t})},doHook:function(n,o,r){var t;if(r=Array.prototype.slice.call(r,1),null!=gform.hooks[n][o]&&((o=gform.hooks[n][o]).sort(function(o,n){return o.priority-n.priority}),o.forEach(function(o){“function”!=typeof(t=o.callable)&&(t=window[t]),”action”==n?t.apply(null,r):r[0]=t.apply(null,r)})),”filter”==n)return r[0]},removeHook:function(o,n,t,i){var r;null!=gform.hooks[o][n]&&(r=(r=gform.hooks[o][n]).filter(function(o,n,r){return!!(null!=i&&i!=o.tag||null!=t&&t!=o.priority)}),gform.hooks[o][n]=r)}});
Submit a comment
“*” indicates required fields
/* = 0;if(!is_postback){return;}var form_content = jQuery(this).contents().find(‘#gform_wrapper_21’);var is_confirmation = jQuery(this).contents().find(‘#gform_confirmation_wrapper_21’).length > 0;var is_redirect = contents.indexOf(‘gformRedirect(){‘) >= 0;var is_form = form_content.length > 0 && ! is_redirect && ! is_confirmation;var mt = parseInt(jQuery(‘html’).css(‘margin-top’), 10) + parseInt(jQuery(‘body’).css(‘margin-top’), 10) + 100;if(is_form){jQuery(‘#gform_wrapper_21’).html(form_content.html());if(form_content.hasClass(‘gform_validation_error’)){jQuery(‘#gform_wrapper_21’).addClass(‘gform_validation_error’);} else {jQuery(‘#gform_wrapper_21’).removeClass(‘gform_validation_error’);}setTimeout( function() { /* delay the scroll by 50 milliseconds to fix a bug in chrome */ jQuery(document).scrollTop(jQuery(‘#gform_wrapper_21’).offset().top – mt); }, 50 );if(window[‘gformInitDatepicker’]) {gformInitDatepicker();}if(window[‘gformInitPriceFields’]) {gformInitPriceFields();}var current_page = jQuery(‘#gform_source_page_number_21’).val();gformInitSpinner( 21, ‘https://e74sq7k37a8.exactdn.com/wp-content/plugins/gravityforms/images/spinner.svg’, true );jQuery(document).trigger(‘gform_page_loaded’, [21, current_page]);window[‘gf_submitting_21’] = false;}else if(!is_redirect){var confirmation_content = jQuery(this).contents().find(‘.GF_AJAX_POSTBACK’).html();if(!confirmation_content){confirmation_content = contents;}jQuery(‘#gform_wrapper_21’).replaceWith(confirmation_content);jQuery(document).scrollTop(jQuery(‘#gf_21’).offset().top – mt);jQuery(document).trigger(‘gform_confirmation_loaded’, [21]);window[‘gf_submitting_21’] = false;wp.a11y.speak(jQuery(‘#gform_confirmation_message_21’).text());}else{jQuery(‘#gform_21’).append(contents);if(window[‘gformRedirect’]) {gformRedirect();}}jQuery(document).trigger(“gform_pre_post_render”, [{ formId: “21”, currentPage: “current_page”, abort: function() { this.preventDefault(); } }]); if (event && event.defaultPrevented) { return; } const gformWrapperDiv = document.getElementById( “gform_wrapper_21” ); if ( gformWrapperDiv ) { const visibilitySpan = document.createElement( “span” ); visibilitySpan.id = “gform_visibility_test_21”; gformWrapperDiv.insertAdjacentElement( “afterend”, visibilitySpan ); } const visibilityTestDiv = document.getElementById( “gform_visibility_test_21” ); let postRenderFired = false; function triggerPostRender() { if ( postRenderFired ) { return; } postRenderFired = true; jQuery( document ).trigger( ‘gform_post_render’, [21, current_page] ); gform.utils.trigger( { event: ‘gform/postRender’, native: false, data: { formId: 21, currentPage: current_page } } ); if ( visibilityTestDiv ) { visibilityTestDiv.parentNode.removeChild( visibilityTestDiv ); } } function debounce( func, wait, immediate ) { var timeout; return function() { var context = this, args = arguments; var later = function() { timeout = null; if ( !immediate ) func.apply( context, args ); }; var callNow = immediate && !timeout; clearTimeout( timeout ); timeout = setTimeout( later, wait ); if ( callNow ) func.apply( context, args ); }; } const debouncedTriggerPostRender = debounce( function() { triggerPostRender(); }, 200 ); if ( visibilityTestDiv && visibilityTestDiv.offsetParent === null ) { const observer = new MutationObserver( ( mutations ) => { mutations.forEach( ( mutation ) => { if ( mutation.type === ‘attributes’ && visibilityTestDiv.offsetParent !== null ) { debouncedTriggerPostRender(); observer.disconnect(); } }); }); observer.observe( document.body, { attributes: true, childList: false, subtree: true, attributeFilter: [ ‘style’, ‘class’ ], }); } else { triggerPostRender(); } } );} );
/* ]]> */
1 US Census Bureau Annual Survey of State and Local Government Finances, 1977-2021 (compiled by the Urban Institute via State and Local Finance Data: Exploring the Census of Governments. Accessed August 13, 2024. https://state-local-finance-data.taxpolicycenter.org.
2 Ibid.
3 Tax Policy Center. “State and Local Direct General Expenditures, Per Capita,” July 10, 2023. https://www.taxpolicycenter.org/statistics/state-and-local-direct-general-expenditures-capita.
4 US Census Bureau Annual Survey of State and Local Government Finances, 1977-2021 (compiled by the Urban Institute via State and Local Finance Data: Exploring the Census of Governments. Accessed August 13, 2024. https://state-local-finance-data.taxpolicycenter.org.
5 Urban Institute. “Wisconsin.” Accessed September 10, 2024. https://www.urban.org/policy-centers/cross-center-initiatives/state-and-local-finance-initiative/projects/state-fiscal-briefs/wisconsin.
The post Misers v. Big Spenders — and where the Badger State fits in appeared first on Badger Institute.